
What we've done
From The Exposure Files, our series on LinkedIn · Follow on LinkedIn
Real work on real insurance data, one problem at a time.
Each page below is a deliverable we provide today, shaped by work with real corporates and their insurance partners. They're listed in the order a corporate experiences the platform:
Neutral infrastructure
Market connectivity and coverage
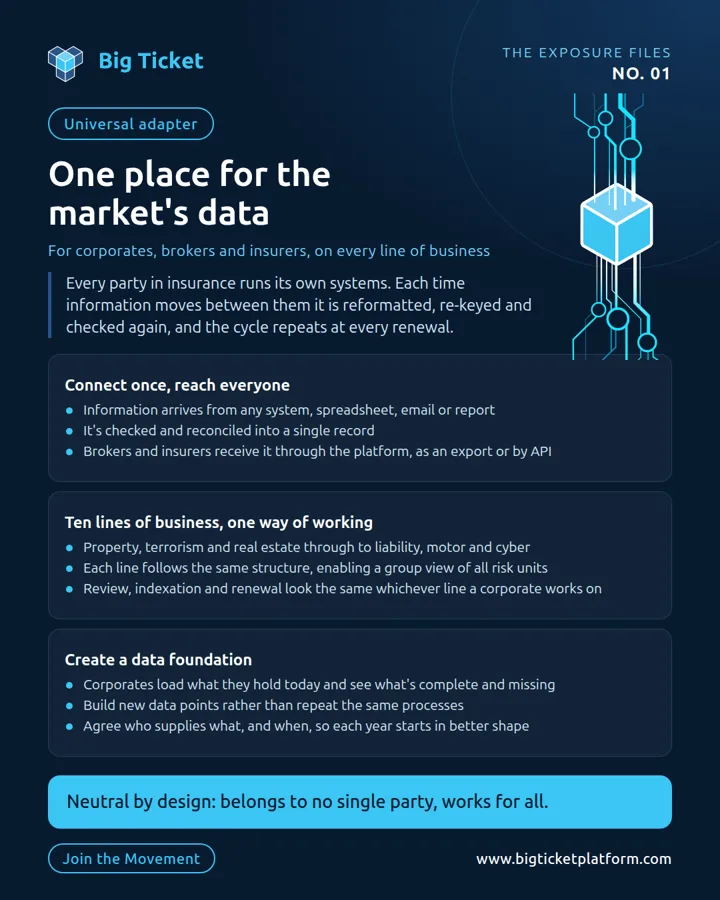
 Universal adapterOne place for the market's dataFor corporates, brokers and insurers, on every line of business
Every party in insurance runs its own systems. Each time information moves between them it is reformatted, re-keyed and checked again, and the cycle repeats at every renewal.
Connect once, reach everyone
- Information arrives from any system, spreadsheet, email or report
- It's checked and reconciled into a single record
- Brokers and insurers receive it through the platform, as an export or by API
Ten lines of business, one way of working
- Property, terrorism and real estate through to liability, motor and cyber
- Each line follows the same structure, enabling a group view of all risk units
- Review, indexation and renewal look the same whichever line a corporate works on
Create a data foundation
- Corporates load what they hold today and see what's complete and missing
- Build new data points rather than repeat the same processes
- Agree who supplies what, and when, so each year starts in better shape
Neutral by design: belongs to no single party, works for all.
 View the one-pager
Core features
Getting data in, finding it and keeping it trustworthy
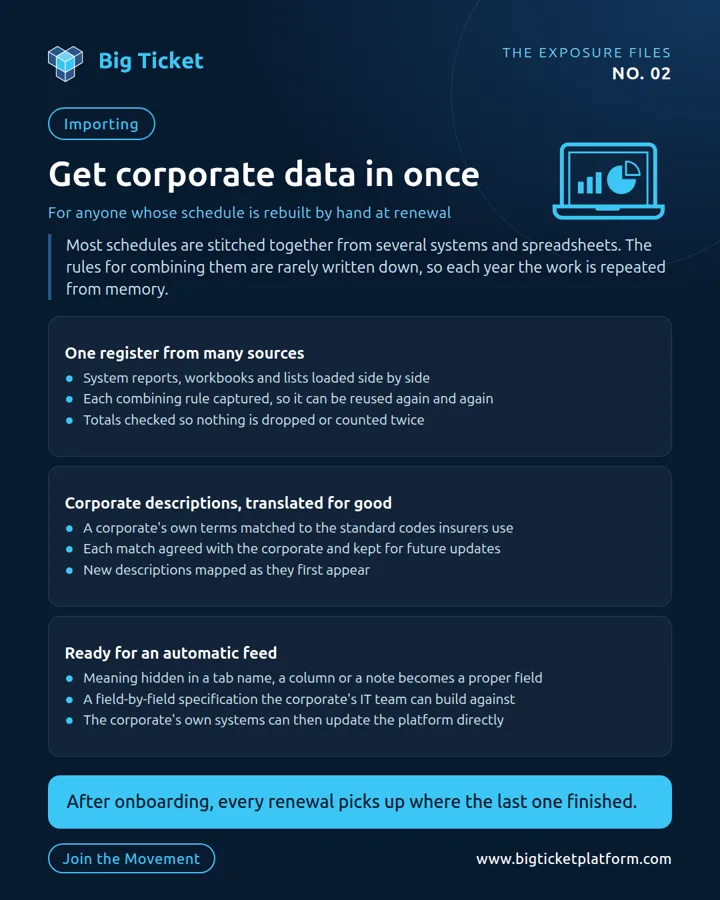
 ImportingGet corporate data in onceFor anyone whose schedule is rebuilt by hand at renewal
Most schedules are stitched together from several systems and spreadsheets. The rules for combining them are rarely written down, so each year the work is repeated from memory.
One register from many sources
- System reports, workbooks and lists loaded side by side
- Each combining rule captured, so it can be reused again and again
- Totals checked so nothing is dropped or counted twice
Corporate descriptions, translated for good
- A corporate's own terms matched to the standard codes insurers use
- Each match agreed with the corporate and kept for future updates
- New descriptions mapped as they first appear
Ready for an automatic feed
- Meaning hidden in a tab name, a column or a note becomes a proper field
- A field-by-field specification the corporate's IT team can build against
- The corporate's own systems can then update the platform directly
After onboarding, every renewal picks up where the last one finished.
 View the one-pager
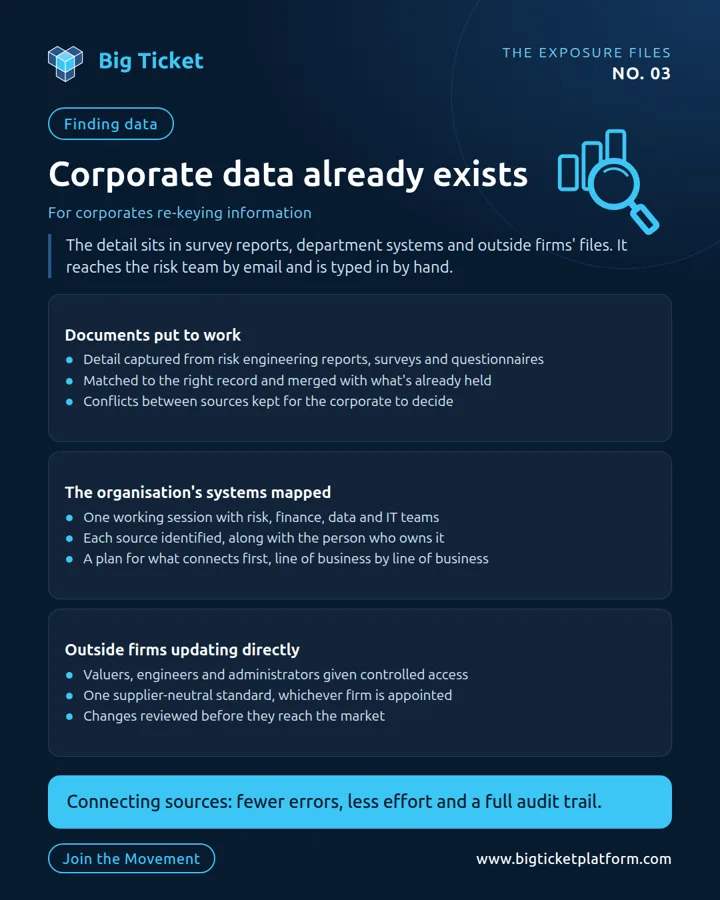
 Finding dataCorporate data already existsFor corporates re-keying information
The detail sits in survey reports, department systems and outside firms' files. It reaches the risk team by email and is typed in by hand.
Documents put to work
- Detail captured from risk engineering reports, surveys and questionnaires
- Matched to the right record and merged with what's already held
- Conflicts between sources kept for the corporate to decide
The organisation's systems mapped
- One working session with risk, finance, data and IT teams
- Each source identified, along with the person who owns it
- A plan for what connects first, line of business by line of business
Outside firms updating directly
- Valuers, engineers and administrators given controlled access
- One supplier-neutral standard, whichever firm is appointed
- Changes reviewed before they reach the market
Connecting sources: fewer errors, less effort and a full audit trail.
 View the one-pager
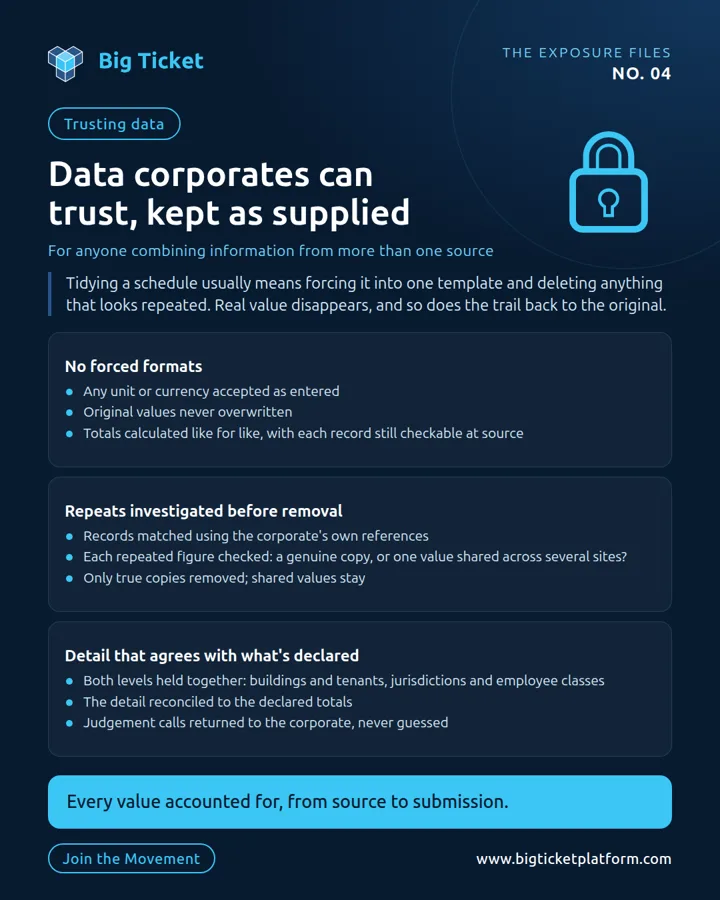
 Trusting dataData corporates can trust, kept as suppliedFor anyone combining information from more than one source
Tidying a schedule usually means forcing it into one template and deleting anything that looks repeated. Real value disappears, and so does the trail back to the original.
No forced formats
- Any unit or currency accepted as entered
- Original values never overwritten
- Totals calculated like for like, with each record still checkable at source
Repeats investigated before removal
- Records matched using the corporate's own references
- Each repeated figure checked: a genuine copy, or one value shared across several sites?
- Only true copies removed; shared values stay
Detail that agrees with what's declared
- Both levels held together: buildings and tenants, jurisdictions and employee classes
- The detail reconciled to the declared totals
- Judgement calls returned to the corporate, never guessed
Every value accounted for, from source to submission.
 View the one-pager
Financials
Values and business interruption
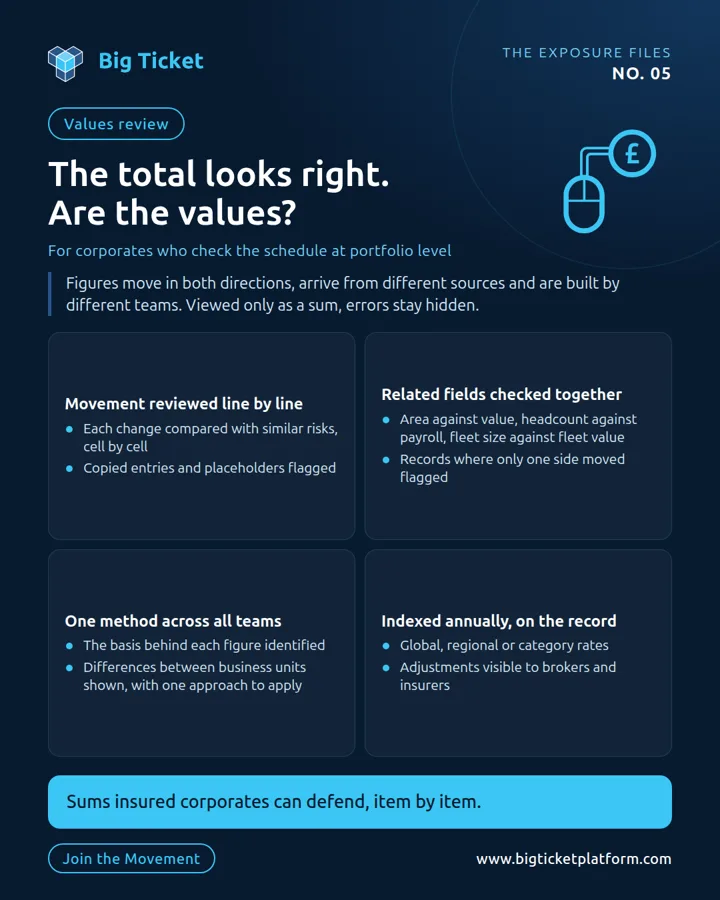
 Values reviewThe total looks right. Are the values?For corporates who check the schedule at portfolio level
Figures move in both directions, arrive from different sources and are built by different teams. Viewed only as a sum, errors stay hidden.
Movement reviewed line by line
- Each change compared with similar risks, cell by cell
- Copied entries and placeholders flagged
Related fields checked together
- Area against value, headcount against payroll, fleet size against fleet value
- Records where only one side moved flagged
One method across all teams
- The basis behind each figure identified
- Differences between business units shown, with one approach to apply
Indexed annually, on the record
- Global, regional or category rates
- Adjustments visible to brokers and insurers
Sums insured corporates can defend, item by item.
 View the one-pager
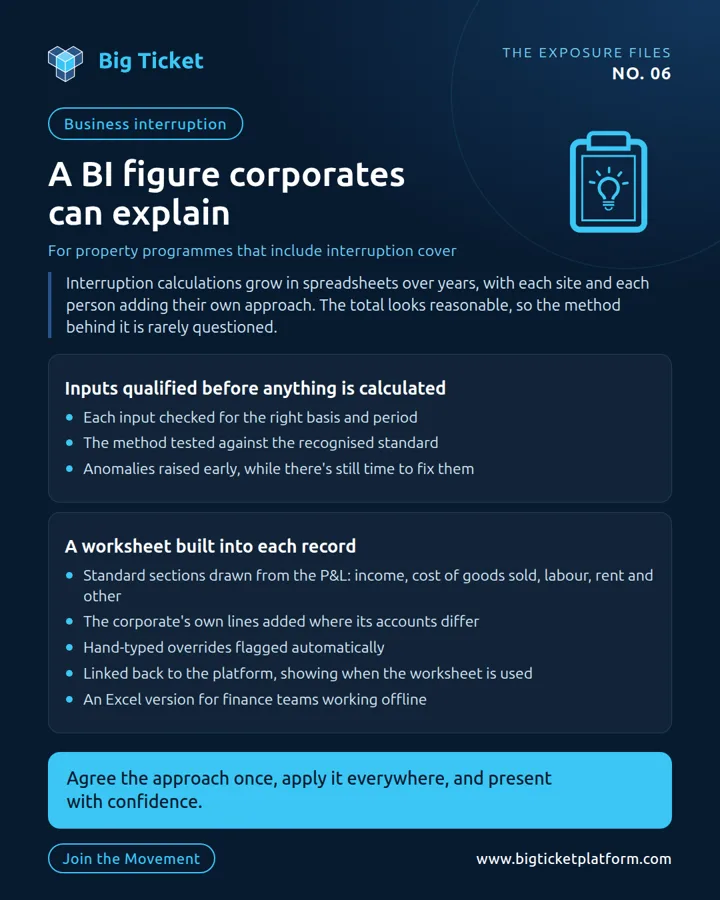
 Business interruptionA BI figure corporates can explainFor property programmes that include interruption cover
Interruption calculations grow in spreadsheets over years, with each site and each person adding their own approach. The total looks reasonable, so the method behind it is rarely questioned.
Inputs qualified before anything is calculated
- Each input checked for the right basis and period
- The method tested against the recognised standard
- Anomalies raised early, while there's still time to fix them
A worksheet built into each record
- Standard sections drawn from the P&L: income, cost of goods sold, labour, rent and other
- The corporate's own lines added where its accounts differ
- Hand-typed overrides flagged automatically
- Linked back to the platform, showing when the worksheet is used
- An Excel version for finance teams working offline
Agree the approach once, apply it everywhere, and present with confidence.
 View the one-pager
Insights
Uncover key insights using additional sources of data
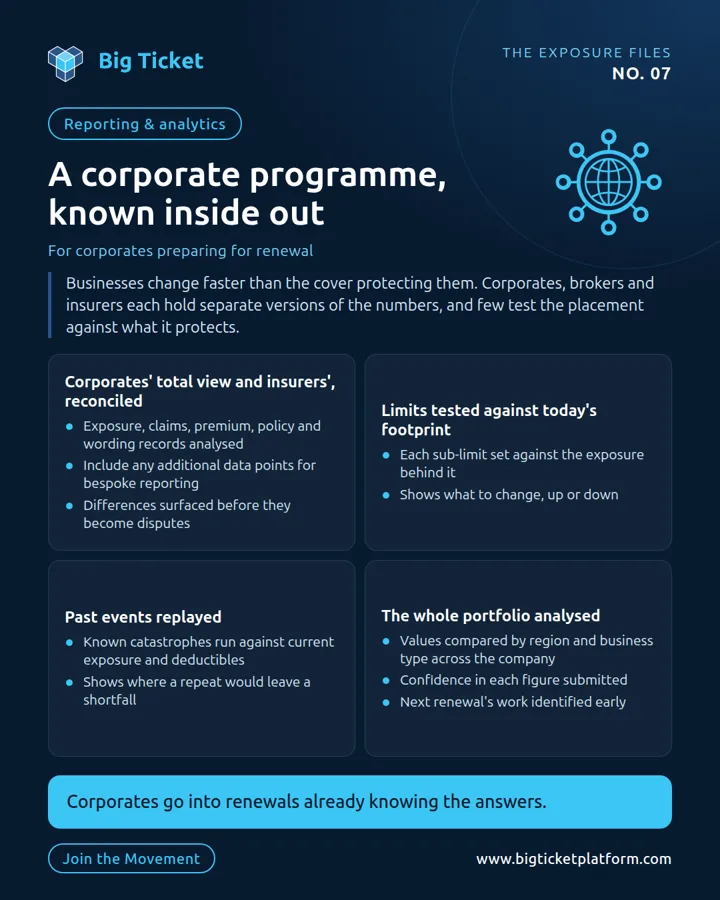
 Reporting & analyticsA corporate programme, known inside outFor corporates preparing for renewal
Businesses change faster than the cover protecting them. Corporates, brokers and insurers each hold separate versions of the numbers, and few test the placement against what it protects.
Corporates' total view and insurers', reconciled
- Exposure, claims, premium, policy and wording records analysed
- Include any additional data points for bespoke reporting
- Differences surfaced before they become disputes
Limits tested against today's footprint
- Each sub-limit set against the exposure behind it
- Shows what to change, up or down
Past events replayed
- Known catastrophes run against current exposure and deductibles
- Shows where a repeat would leave a shortfall
The whole portfolio analysed
- Values compared by region and business type across the company
- Confidence in each figure submitted
- Next renewal's work identified early
Corporates go into renewals already knowing the answers.
 View the one-pager
Built with risk managers
These deliverables were shaped with the SIG's corporate members: a coalition of risk managers, sponsored by Airmic and powered by Big Ticket, changing how insurance data moves between buyers, brokers and insurers.